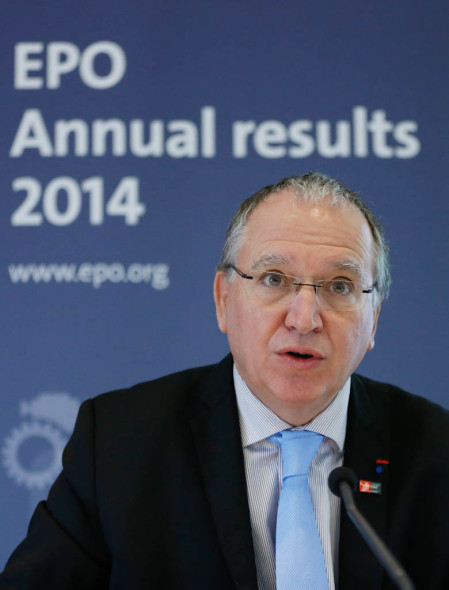
Patent filings at the European Patent Office (EPO) grew again in 2014 to 274 000 (+3.1%), reaching a new record level. Companies from Poland filed 701 patents, a steep increase of +22% over the previous year, making Poland one of the fastest growing countries in terms of patent filings (exceeding the 18% growth of China). Since 2010 the number of patent filings from Poland has more than doubled (2010: 343 applications).
“Demand for patent protection in Europe has been growing steadily, and is up for the fifth year in a row,” says EPO President Benoȋt Battistelli. “Europe continues to strengthen its key role as a global hub of technology and innovation for a growing number of companies from around the world. The rise in patent filings originating from Europe underlines the importance of patent-intensive industries as a solid base for the European knowledge economy: They foster Europe’s competitiveness, economic strength and employment.”
Medical Technology at the top of the leading technology fields in Poland
Patent applications at the EPO from Poland showed the strongest growth in Medical Technology (from 2% to 7% of all Polish patent applications within the last year), and Computer Technology (from 3% in 2012 to 5% in 2013 to now 6%). The five leading fields of technology were Civil engineering, Medical Technology, Computer Technology, Thermal Processes, and Special Machines.
With Akademia Gorniczo-Hutnicza being the 3rd largest patent applicant at the EPO from Poland, a university was high in the rankings of Polish applicants in 2014. Patents Factory Ltd. sp. z o.o. was Poland’s No. 1 applicant and International Tobacco Machinery Poland sp. z o.o. No. 2.
Looking at European patent applications per million inhabitants, Poland, with 12 (up from 10 in the previous year), ranked 28th, up from 30th place previously, just behind the Czech Republic (27th) and ahead of Hungary (30th) and Portugal (32nd) but below the EU-28 average of 131 applications/million inhabitants.
Regional differences in Europe, strong growth from China and US
For Europe, the 1.2% growth in the volume of filings coming from the 38 EPO member states in 2014 was based on varied trends in individual countries. Besides the +22% growth from Poland, there was also strong growth in filings from Slovenia (+12.6%), the Netherlands (+9.1%), Portugal (+7.6%),Turkey (+6.2%), the UK (+4.8%), Austria (+4.5%) and France (+4%). A stable development was noted from (+2%), Belgium (+1.8%), Italy (+0.5%) and Germany (-0.8%), while there was a fall in the number of filings from Finland (-9.3%), Switzerland (-3.1%), and Spain (-2.1%). Filings from the US increased significantly, by 6.8%, over the previous year. With an increase of 18.2%, China once again showed another spectacular rise in filings. South Korea maintained its growth, albeit at a much slower rate (+2.3%), in contrast to Japan which – in spite of a high volume of filings – dropped by -4.4% in 2014.
Samsung holds onto first position, while five European firms make the top ten
Samsung once again headed the list of top applicants at the EPO with 2 541 applications in 2014. European companies maintained their strong presence among the leading companies in terms of applications filed, with five firms in the top ten. No. 2 was Philips, followed by Siemens (3rd), BASF (6th), Robert Bosch (8th) and Ericsson (9th). With Huawei in 5th, a Chinese company entered the EPO’s top ten for the second time ever (ZTE was 10th in 2012). The US firms Qualcomm (7th) and Intel (10th) rounded out the top ten.
Contrary to the expectations that the EPO’s predominantly used by large corporations, a breakdown by category of applicants shows that 30% of applicants were small and medium-sized enterprises (SMEs). This underlines the important role the EPO plays as service provider for smaller companies. Some 6% of the applicants were research institutes or universities. The percentage of large corporations was 64%.
For detailed statistics, and a report on activities in 2014, see the EPO’s online annual report at: www.epo.org/annual-report2014